Linux process scheduling and prioritization
| Running the exercise in a VirtualBox virtual machine
This exercise makes use of multiple cores, assuming your
machine has them. Most modern machines do. A "core" is, in
effect, a cpu. If you are doing this exercise in a VirtualBox (VB) virtual
machine, you can to configure it to have as many cores as you want up to
the number of actual cores offered by the physical host machine. You do so in
VB's "Settings" for a virtual machine:
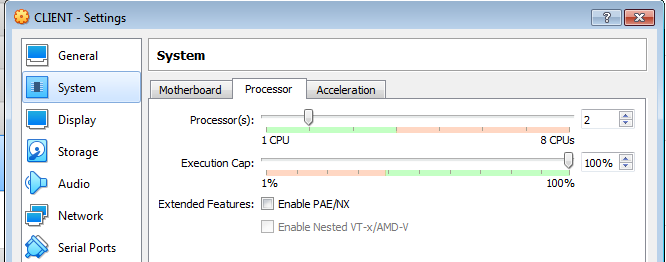
Above, in a host machine that has 4 cores the virtual machine is told to use 2 of them. The green portion of the "Processor(s)"
bar shows how many cores are detected in the host.
In the provided virtual machine log in as student, bring up the GUI,
open a terminal window, and become root. Operate the exercise there. In VB
set the number of cores to the number your particular machine offers.
You will want a split screen display. Use the terminator program for that:
terminator -f &
In the resulting terminal window right mouse click then choose "Split Horizontally" from the resulting menu (or, keystroke ctrl-shift-O). You now have two windows, in which you can run two commands independently. Move back and forth between them with the ctrl-Tab key combination or by mouse clicking in the one you wish to select.
In order to enable more content to be shown in a window, you can reduce
the font size with keystroke ctrl-minus.
The exercise directs you to use file process_priority.zip. In the
provided virtual machine it can be found in /home/public. It can be copied
to the current directory (at the point in the exercise where the file is
called for that will be ~/scheduling) by:
cp
/home/public/process_priority.zip .
|
This exercise uses a program that wastes time by operating a triple nested loop.
You can calibrate it to use more or less CPU cycles by choosing a greater or
lesser loop counter value. You can also set a priority, expressed as a value in
the range from -20 (highest priority) to 19 (lowest priority). Linux calls this
the "nice value."
Create a directory in which to do the exercise, and make it your working
directory:
cd ~
mkdir scheduling
cd scheduling
Obtain the file process_priority.zip per your instructor. Get it or put it
into your directory. Unzip it.
unzip process_priority.zip
Compile the two C language programs that emerged:
gcc process_priority.c -o process_priority
gcc process_priority-realtime-version.c -o process_priority-realtime-version
Run the former:
./process_priority
and note the advisory message:
Please type:
process_priority <loop count limit> <nice value>
Re-run it, supplying the 2 requested arguments. Use 500 for "loop
counter limit" and 0 for "nice value."
./process_priority 500 0
Depending how long the program takes to complete (longer on a slower machine,
shorter on a faster one), change the loop counter limit till the program lasts
for an appreciable time like 10 or 20 seconds. It might be in the high hundreds
for a slow machine up into the low thousands for a fast one. Raising the value a
little slows down the program a lot. Interrupt the program any time with ctrl-C
if it is taking too long. You can measure how long the program is taking just by
noting it approximately, or by your wristwatch, or if you want to be precise you
can let the computer do it:
time ./process_priority 500 0
Calibrate this thing by raising 500 to the point that "time"
reports a "real" or elapsed wall time of about 15 seconds. Suppose the
counter value that yields 15 seconds is 1500. Run the script again but put it in the background
this time and, while it persists, run the jobs command
to see it there:
./process_priority 1500 0 &
(after running this command you may not see a prompt, but it is there. Go ahead
without reluctance and issue the ensuing "jobs" command as normal.)
jobs
Run "jobs" a few more times till it reports that the program has exited
(terminated). That'll be after 15 seconds. Run again, but 3 times now:
time ./process_priority 1500 0 &
(you can press the up-arrow key to bring a command back onto the command line to
repeat it)
time ./process_priority 1500 0 &
time ./process_priority 1500 0 &
jobs
After a while all 3 processes will have exited. "jobs" will tell you so.
There will be screen output also, from each process, telling you it's finished
and how long it took. Interestingly, if it takes 15 seconds to run, so that
running two instances simultaneously might be expected to take 30 seconds, you
may observe that it took only 15 seconds to run both 15-second processes.
If so, it's probably because you have a multi-core CPU with two (or more) horses
hitched to the plough. If you know the number of cores you have, you could try
running as many processes as cores and it will still take just 15 seconds but
going beyond that should raise the time needed because core sharing will become
necessary. Some commands that may be installed on your machine can indicate how
many cores you have and other information about your CPU:
nproc
lscpu
more /proc/cpuinfo
I have a shell script for you that launches process_priority similarly. It
does so 5 times, placing it in the background like you did. Look at the script's
code to see that:
head process_priority-tester.sh
Note that, as delivered, it uses
1200 as loop counter value. Change that by editing in the calibrated value you
chose above, in place of 1200. Do it with any editor, or use the stream editor
sed to do the job in one single-command stroke, for example:
sed -i s/1200/1500/ process_priority-tester.sh
[sed "stream editor" is a search-and-replace command.
Here it will replace occurrences of "1200" with "1500"
instead.]]
Now look at the source code again to note and verify that 1200 has been replaced with your
number:
head process_priority-tester.sh
This script runs the program a little differently than how you did it, in
that it gives each of the 5 instances a different priority. One has a
greater/better priority than all the others (-20), another a lesser/worse one
(19). Also, it suppresses the progams' screen output, which you saw on screen
when you ran it. Instead it puts that output into a file called output.tmp. And
it runs our program under control of "time," the utility that measures
and reports the time consumption of each process instance of the program.
Now run the script as follows, then use jobs to follow up:
source ./process_priority-tester.sh
jobs
Keep running "jobs" periodically till you notice the jobs start to exit, one by
one. Note the order in which they go. The highest priority one finishes first,
then down through that lowest priority slowpoke. When they have all exited,
examine the content of output.tmp
cat output.tmp
It will show the programs' output, in the order in which they terminated.
Typical output from a single run of the process_priority will be:
PID = 2941
scheduling policy = 0
sched_priority = 0
nice value = 10
10.40user 0.00system 0:43.23elapsed 24%CPU (0avgtext+0avgdata 0maxresident)k
0inputs+8outputs (0major+117minor)pagefaults 0swaps
Note the nice value, 10. The processes with nice values -20, -10, and 0
should have finished before this one. The process with nice value 19 should
finish after it. Look also at the "user" and "elapsed"
times. Here, elapsed time from when the process began till it terminated was
43.23 seconds. But within that interval, the process was only utilizing the CPU
(i.e., actively running) during 10.40 seconds. The rest of the time it was
waiting around on the sidelines while other code had the CPU. The ratio between
these is shown, 24% in this case (10.40/43.23). It is a measure of how
"attentive" or "neglectful" the scheduler was toward the
process. Note its range, across the 5 processes, and that it is highest/best for
the top-priority process and tends lower for the others as their priorities
decline.
Open a second terminal on the machine and in it run the top command:
top -i -c
[ -i = don't show idle processes, -c = display processes'
full command lines ]
Back in the first terminal, run your 5 variable-priority instances of
process_priority again:
source ./process_priority-tester.sh
While they are running, observe their appearance in top. Pay attention to the
nice values (column headed "NI" in top's screen output), the %CPU
metric of per-process CPU usage, and the order in which the 5 processes retire.
Finally, let's run these 5 processes, plus a 6th one that is a real-time
process (our 5 are not, they are "normal" processes). Launch the 5
with our script, then launch the real-time process:
./process_priority-tester.sh
/usr/bin/time ./process_priority-realtime-version 1500 7
While all this is running, look at top. The real-time process should tend to
"jump the queue" and get immediate continuous CPU access. And when it
finishes, the %CPU value reported by /usr/bin/time should be high. Compare it
with those of the 5 concurrent normal processes, which you will be able to see
in output.tmp. Realtime processes receive preferential treatment.
Here are some additional explorations for you to try:
1) In top, if you press the 1 key (numeral one) it toggles top's display of CPU
information. Instead of a single-line report, it will display a separate
line for each CPU or core in your machine. If you see some cores that are not
busy, you can pile work onto the machine by running process_priority-tester.sh
more times. Each time you do, 5 new processes arise and you should see all the
cores get to work.
2) While you have all the processors working hard, note the "%CPU"
column showing what percentage of the CPU resource each process uses. You may
see numbers that add up to more than 100%. Again, this reflects that you have
multiple cores. So if you have 4 cores, don't be surprised at numbers that add
up to more than 100 but do be surprised if they add up to more than 400. If you
want top to normalize this display so that the numbers reflect the share of aggregate CPU power, not that of an individual core, use the I key toggle.
3) You have been running a script that spawns 5 regular processes that fight
among themselves. Then you added a single big dog (realtime) process that
overshadows them all. What if there are multiple big dogs all scrapping for the
CPU? There is another version of my script for that,
process_priority-realtime-version-tester.sh. Experiment with it. You may find
that as you run it your shell becomes sluggish or even unusable because it is
not realtime. The realtime processes you are spawning outcompete your shell so
that it must stand in line for a chance to serve you further.
3) Repeat these tests after changing the number of CPU cores in use on your
computer. You probably have a multi-core CPU, and by default it uses all the
cores. You can disable one or more of them, provided not all of them, and see
the effect on performance.
If you have 4 cores, there will be a subdirectory named for each (cpu0
through cpu3) under /sys/devices/cpu. In all of them except /sys/devices/cpu/cpu0/
there will be a file named "online". It is used to enable or disable
its core.
nproc [how many
available cores?]
ls -1 -d /sys/devices/system/cpu/cpu?
ls -1 /sys/devices/system/cpu/cpu?/online
cat /sys/devices/system/cpu/cpu?/online
If one of the "online" files "1" its core is enabled. If
"0" it's disabled. To disable core1:
echo 0 > /sys/devices/system/cpu/cpu1/online
nproc
Now utilities such as top will reflect awareness aware there are only 3 cores
available. The dispatcher will also know there are only 3 cores across which to
distribute processes. Multi-threaded applications will themselves have reduced
performance as will the system as a whole. To re-enable:
echo 1 >
/sys/devices/system/cpu/cpu1/online
nproc